Look up any player before you bet their prop.
ET Parlays Player Lab is where you do the digging, in six sports. Graph any prop against any line, game by game. See the splits, the matchup and the game log. Tap any stat and it tells you what it means. And where we have a number, you see our chance next to the book’s, with a public record of how often our chances have landed.
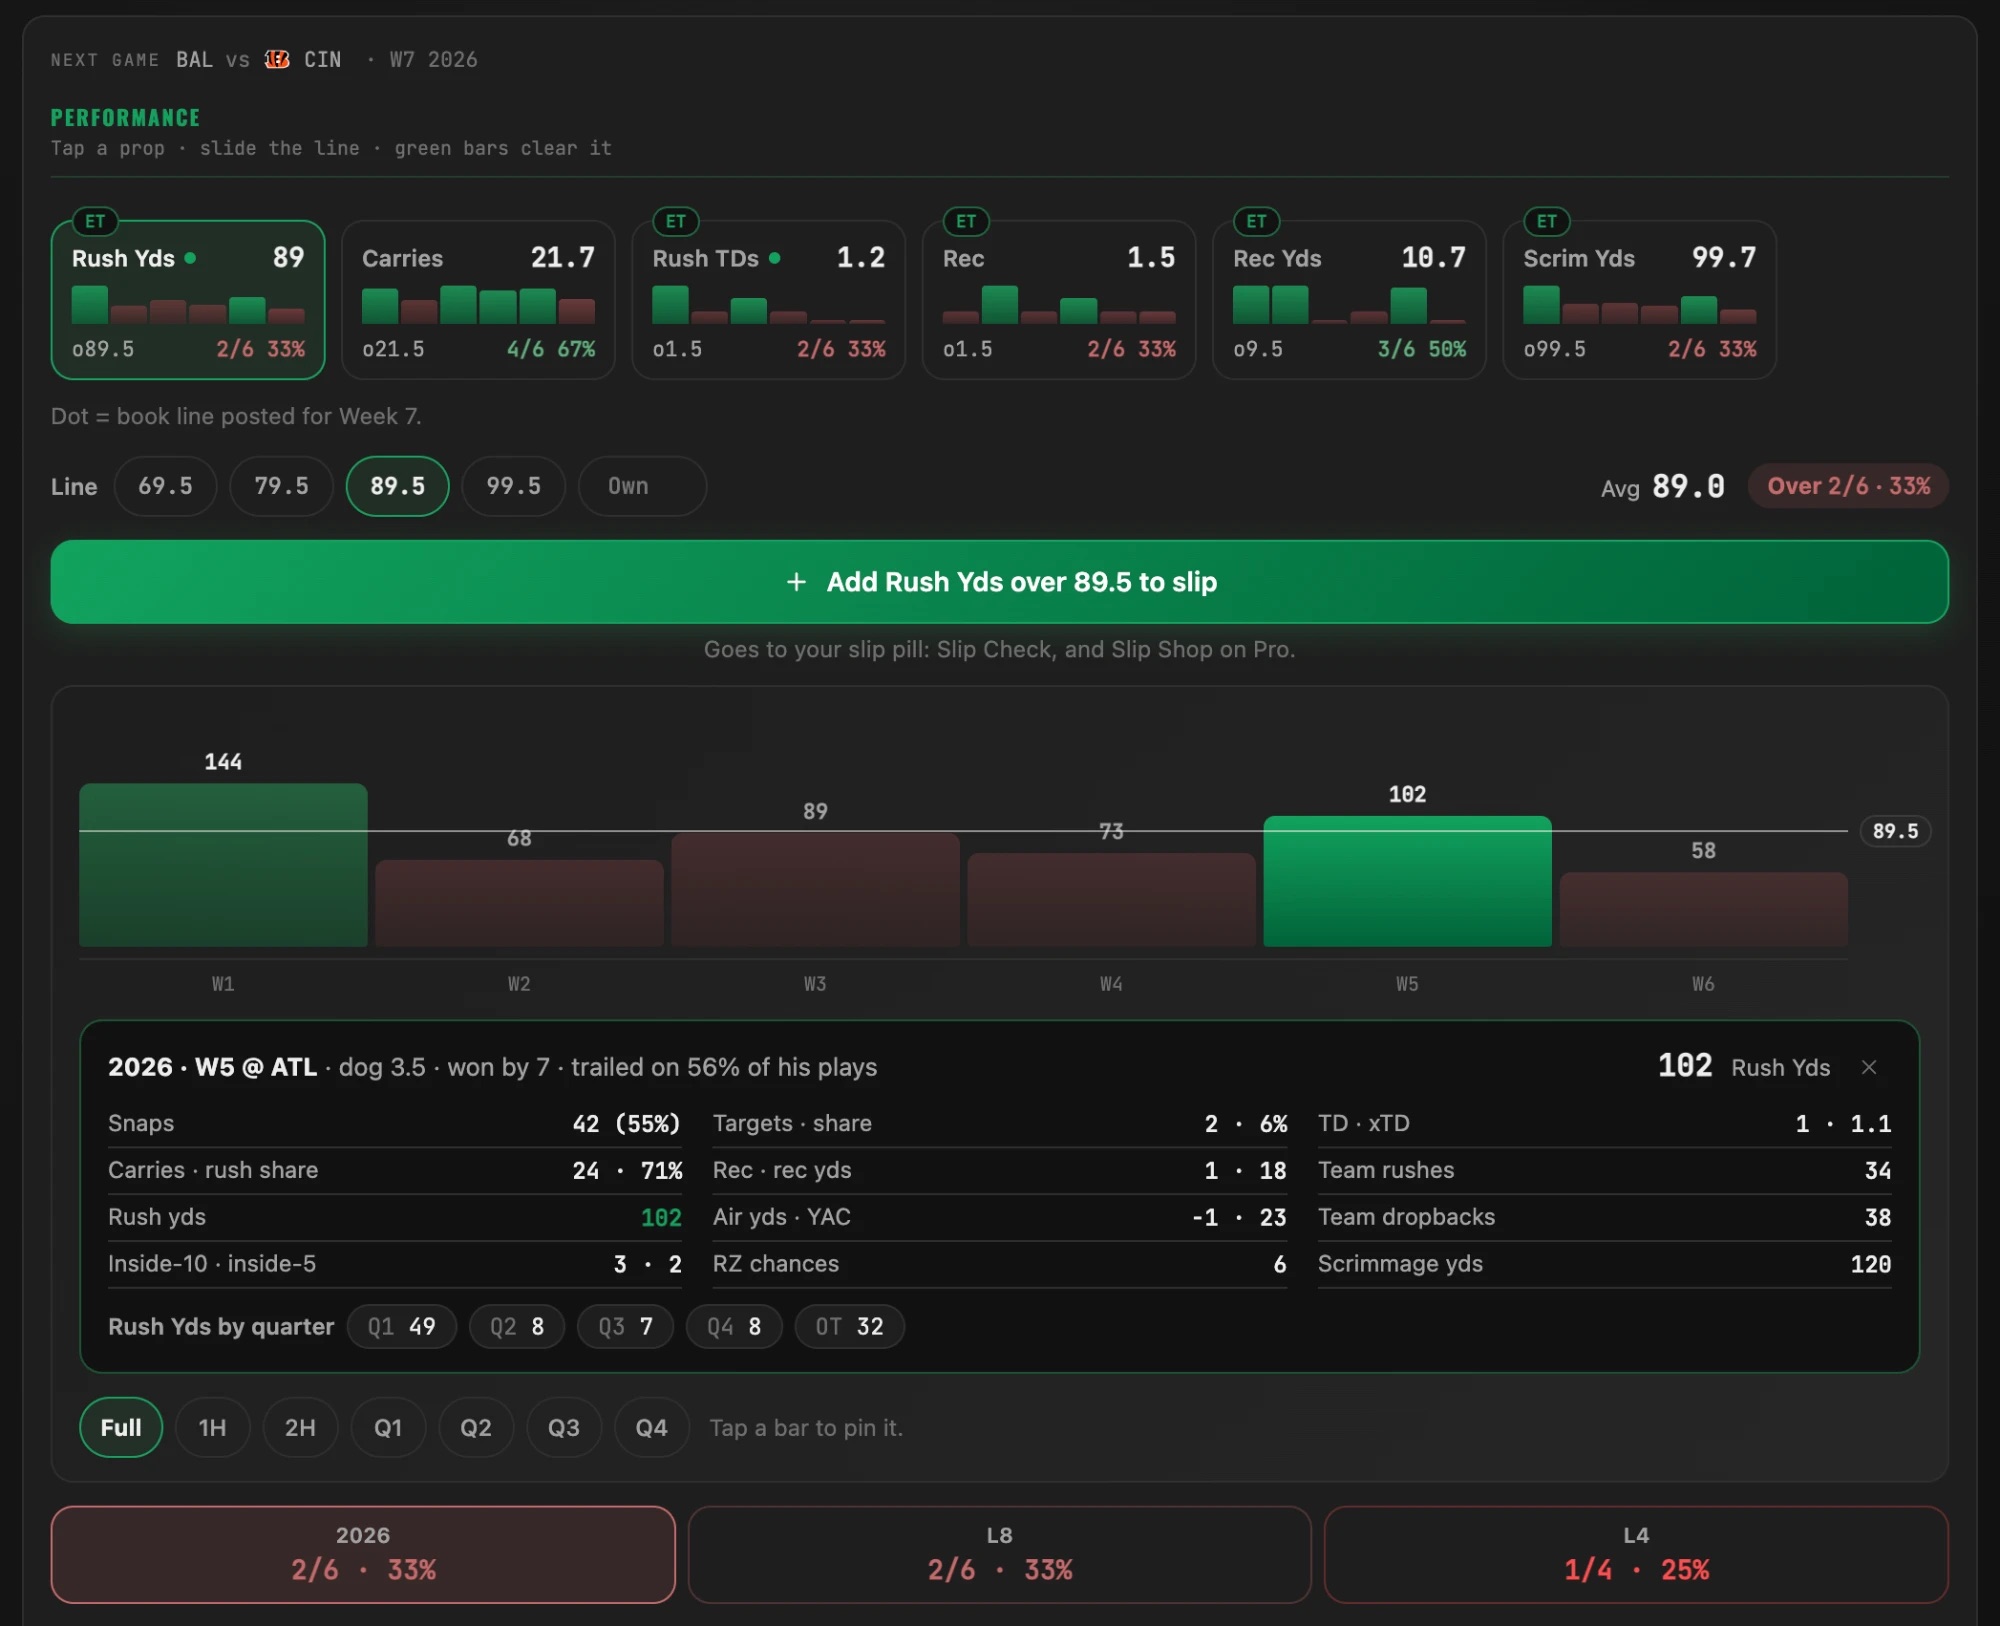
A graph for every prop
Every sport’s Lab opens on a player’s graph: one bar per game, a line across it, green where they cleared it and red where they missed.
- Pick the prop. Each prop chip shows the average, a strip of the last ten games, and how many cleared the line.
- Set the line. Tap a preset or type your own in the Own box, and the bars and the hit count follow it.
- Change the window. The season, last season, the last 5, 10 or 20 games, or against tonight’s opponent, depending on the sport.
- Tap a bar. You get that game’s full line. In the NFL that includes snaps, target share, air yards and red-zone chances.
- Split the game, in the NFL. Full game, either half, or any quarter, from play-by-play.
Every number explained
The Lab is built for someone who has placed a handful of parlays, not for a quant. So it teaches as you go.
- Tap any stat (barrel rate, usage, true shooting, target share) and the Lab tells you what it means.
- Most tabs have a primer, the small “i” beside the tab name: what the tab shows and how to read it.
- Some tabs say what they won’t do. The NFL Matchup tab marks each part Strong, Mixed or Thin and says whether it leans with our number or against it. Recon shows every line and no ET number at all.
- The Learn tab walks you through checking a player step by step, and the Learn articles explain the ideas behind the numbers.
Every sport, tab by tab
Each sport has research tabs, for one player or one game, and reference tabs, for the whole slate.
MLB Player Lab
ET PlusTwo research tabs, one for hitters and one for pitchers, and seven reference tabs for the whole slate.
- A graph for 11 props, from hits to home runs to walks, against any line you set: this season, last season, the last 5 to 20 games, or games against tonight’s opponent.
- The power profile, power by hand, and the last 15 days of form, so you see who they are right now.
- How they hit each pitch type, set against the pitches tonight’s starter actually throws, with their career history against that starter.
- Tap any stat, like barrel rate, and it tells you what it means.
- A graph for strikeouts, outs, hits, walks and earned runs allowed, against any line.
- The K Lab for strikeout props, the season line, and splits against lefties and righties, home and away.
- The full arsenal: each pitch, how often it’s thrown, and what hitters do against it.
- The last starts, and a first-inning lean for anyone betting whether a run scores in the first.
NFL Player Lab
ET PlusFive research tabs and four reference tabs, built around the thing that predicts football best: who gets the ball.
- A graph of every prop that fits the position, for the full game, either half or any quarter, from play-by-play. Season, last 8 or last 4, with ET’s projection drawn on it.
- Tap a game and it opens: snaps, carries and rush share, targets, air yards, red-zone chances, touchdowns against expected, and yards by quarter.
- ET’s chance at every line on passing props. On rushing and receiving, the books’ chance with their cut taken out (more on that below).
- Profile stats that explain themselves when you tap them, the full game log, and any warnings on the read.
- Pick a player, a prop and a line. You get ET’s projection and chance against the book’s, and the read behind it in plain English.
- The parts: the player’s role and whether it’s moving, this defense against players in that role, the game environment, their own season at this exact line, and the price.
- Each part is marked Strong, Mixed or Thin, and says whether it leans with ET’s number or against it.
- Snap share, target or rush share, air-yard share and red-zone chances, game by game.
- Each one drawn against the player’s own season and their normal week-to-week swing.
- It calls a role expanding or declining only when the last two games clear the bar. One big week is a blip.
- Pick anyone on a team, or run a what-if, and see what teammates actually did in the games that player missed.
- Target share, rush share, snaps and red-zone chances, with and without, with the games counted.
- If the player has never missed a game with this roster, it says so and names who is next by role. It never invents a split.
- Pick a game and a prop: every player, every line the books posted, and how often each player has gotten there this season, one dot per game.
- The books’ chance at each line, and Q1 to Q4 tabs for each player’s numbers by quarter.
- Tap lines to collect legs. The tray multiplies the books’ chances and sets them next to what your payout implies.
- No ET number here. It’s the raw research, laid out.
NBA and WNBA Player Lab
NBA on ET Plus, WNBA on ET ProFour research tabs and two reference tabs, the same in both leagues.
- The model’s chance next to the book’s for tonight’s game, with a plain-words line on why.
- A graph for points, rebounds, assists, threes, steals, blocks, and points plus rebounds plus assists, over or under any line: last 5, 10 or 20, the season, last season, or against tonight’s opponent.
- How tonight’s opponent defends the position, the last games against them, and why the projection is what it is.
- Every line the books posted, the game log, and stat chips (usage, true shooting, pace) that explain themselves.
- Last ten and season averages for points, rebounds, assists and threes, beside what that defense allows to starters at the position.
- The league average and the defense’s rank, with both teams’ pace and ratings under it.
- Numbers side by side. No read, no lean, no line.
- Every player’s minutes over the last 5, last 10 and the season, and their starts.
- Expanding or declining only when the last two games both clear the bar. One game is a blip.
- No projection and no lean. Only the minutes.
- How often each player has gotten to each line this season, one dot per game.
- The books’ chance at that line, with their cut taken out where both sides are priced.
- Tap lines into a tray that multiplies the books’ chances and compares them to your payout. No ET number here.
Soccer Player Lab
ET ProTwo research tabs and two reference tabs.
- A graph for shots, shots on target, goals, assists, and goal or assist: last 5, 10 or 20 matches, the season or last season.
- How secure their minutes are, and whether their finishing is running hot or cold.
- Form, home and away, the matchup, and goals against expected goals.
- Prop angles you can add to your slip.
- Saves and goals against, on the same graph, against any line.
Tennis Player Lab
ET ProOne card per player.
- The season strip: record, hold rate, and serve and return points won.
- A matchup read, recent form with splits, the head-to-head, and a match log.
NHL is being built and isn’t open yet. When it opens, it will be on ET Pro.
Our chance next to the book’s
The book’s price says how likely it thinks a prop is. Where we have a number, the Lab shows ours beside it, so you can see where we agree with the price and where we don’t. Here is one real week, every read we posted on the market, the hits and the misses.
| Player, line | ET | Book* | Threw |
|---|---|---|---|
| Patrick Mahomes 226.5 | 63% | 53% | 272 hit |
| Bryce Young 239.5 | 63% | 52% | 281 hit |
| Drake Maye 236.5 | 59% | 53% | 235 miss |
| Tanner McKee 190.5 | 59% | 53% | 215 hit |
| Sam Darnold 220.5 | 55% | 53% | 278 hit |
| Matthew Stafford 283.5 | 54% | 53% | 222 miss |
| Jalon Daniels 177.5 | 54% | 53% | 164 miss |
ET said 58% on average. 4 of 7 landed, and 3 missed. Seven reads is one week, not a record: the record is further down. *The book’s chance is what its over price implies, with its cut still in.
Where the Lab shows the books’ number instead of ours
On NFL rushing and receiving props, our chance didn’t land any more often than the books’ prices said it would. So on those markets the Lab shows the books’ chance, with their cut taken out where a book posts both sides. We still write our own number down before every kickoff, and it comes back when a graded week shows it beats the books. The better number is the one you should see, even when it isn’t ours.
How often our chances have landed
A read that says 60% loses four times in ten when it’s exactly right. So the record shows what we said, how many times we said it, and how often it landed.
1,278 MLB player prop reads graded between September 10, 2026 and September 27, 2026, each written down before first pitch, read from the database when this page loads. Misses included.
| Market | Reads | ET said | Landed |
|---|---|---|---|
| Home runs | 329 | 18% | 18% |
| Total bases | 345 | 39% | 39% |
| One or more hits | 285 | 63% | 61% |
| Hits plus runs plus RBIs | 319 | 49% | 48% |
“ET said” is the average chance ET showed on those reads. A market lines up when the two columns are close.
And the part that doesn’t flatter us: the widest gap was on home runs. Before September 10, 2026, when the model said 50 to 60%, those reads hit 26%. On September 10 we cut the home run numbers the board shows. Since then, 329 home run reads said 18% on average, and 18% landed. That’s two and a half weeks of games, so it’s a start, not proof.
How we grade, and where our numbers run hot: the methodology page. The NBA record started this season, so there isn’t much of it yet.
From the Lab to your slip
Like a prop? Add it to your slip from the graph. Your slip opens in Slip Check, which reads every leg and flags the risks, and on ET Pro in Slip Shop, which shows what the slip pays at each book. The Recon tabs send a whole tray of legs to the Builder, where you put the slip together yourself.
Team Lab
Team Lab is the same idea for game bets: a team’s record against the moneyline, the spread (the run line in baseball) and the total, the situational spots, and its last ten games. MLB, NFL and NBA, on ET Plus, which also carries our chance on every MLB and NFL game beside the book’s price.
What Player Lab won’t do
- Build a slip for you. You pick the props. The Lab shows you what is behind them.
- Promise a prop hits. A 70% chance misses three times in ten, and those misses aren’t bad luck.
- Put a number on everything. Recon and the Matchup tabs show the research without a read, and NFL rushing and receiving show the books’ number.
What it costs
Free: the player card on every pick on the slate, with the season line, form and splits. ET Plus, $19.99 a month or $199 a year: Player Lab and Team Lab for MLB, NFL and NBA, any player, the whole slate. ET Pro, $49.99 a month: adds WNBA, soccer and tennis, and Slip Shop. Already have a slip? Slip Check reads it leg by leg, free, no account.
Questions
What can I look up in Player Lab?
Any player in MLB, NFL, NBA, WNBA, soccer or tennis: a graph of every game against any line you set, splits, the matchup, the game log, and ET’s chance beside the chance the book’s price implies. Every stat has a tap that says what it means.
Which sports does Player Lab cover?
MLB, NFL and NBA on ET Plus, $19.99 a month. WNBA, soccer and tennis on ET Pro, $49.99 a month. NHL is being built and isn’t open yet.
How is Player Lab different from a hit-rate app?
A hit rate tells you how often a player cleared a number. Player Lab shows that on a graph you can move, then shows ET’s own chance next to the book’s, explains every number, and publishes how often ET’s chances have landed, misses included. Where ET’s number hasn’t beaten the books’, the Lab shows the books’ number instead.
Can I set my own line on the graph?
Yes. Pick one of the preset lines or type your own in the Own box. The bars that clear it turn green and the ones that miss turn red, and the hit count updates.
I’m new to props. Will I understand it?
That’s who it’s built for. Every stat in the Lab explains itself when you tap it, most tabs have a short primer on what they show and how to read them, and the Learn tab walks you through checking a player step by step.
How accurate are ET’s player prop chances?
The record is public, market by market: what ET said, how many reads it said it on, and how often they landed. Some markets line up closely and some ran hot, and the page says which. A read that says 60% loses four times in ten when it is exactly right.
Does Player Lab pick props for me?
No. It shows the research and ET’s chance, and you decide. You can add a prop to your slip from the graph, and Slip Check then reads the whole slip, but the Lab never builds a slip for you.
Is Player Lab free?
The player card on every pick on the slate is free: the season line, form and splits. Looking up any player, across the whole slate, is ET Plus, $19.99 a month or $199 a year.